You think you know where the bottleneck is. Then you open the profiler and realize you’ve been chasing the wrong problem for an hour.
Most performance bugs start with a guess. You load your game, notice a frame drop, and think it must be the GPU or the physics. Then you spend an hour optimizing the wrong thing.
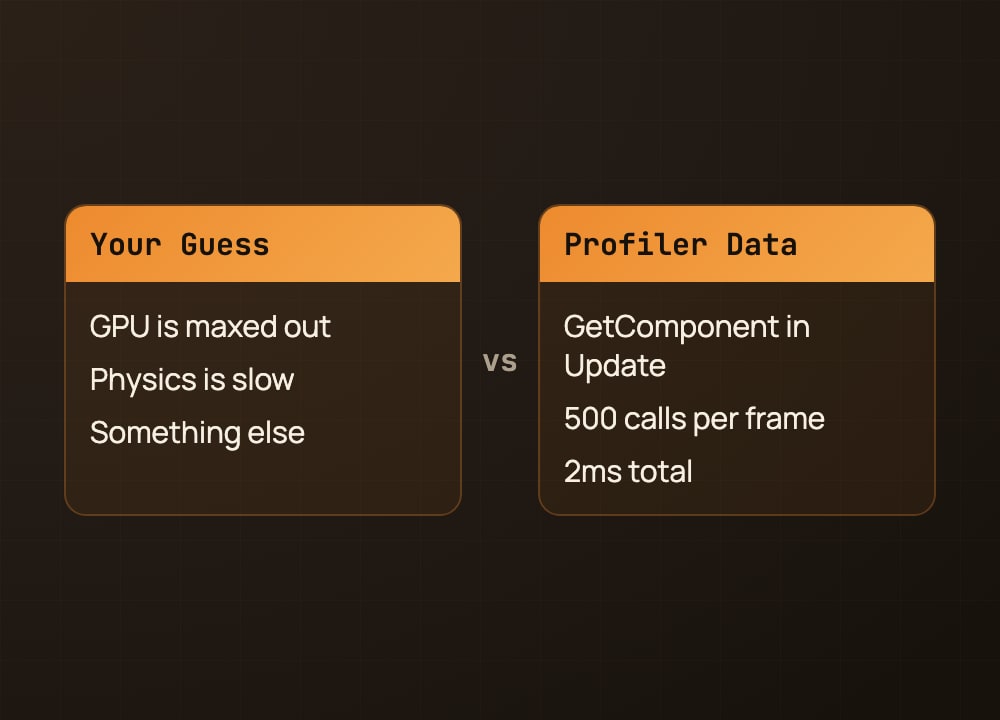
The profiler is a mirror. Open it, and you see the actual frame time breakdown: CPU, GPU, rendering, physics, scripts – all measured. Unity’s built-in Profiler (Window > Analysis > Profiler) shows you exactly where your frame time goes. You’ll often find the culprit isn’t what you guessed.
I’ve watched frame rate improve significantly because we profiled first. A GetComponent call buried in Update, called every frame on 500 objects – that’s usually the one. The profiler finds it in seconds. It takes a minute to learn but saves hours of guessing.
Before you optimize, profile. It’s the discipline that separates confident debugging from expensive guessing.
Save this post for next time you’re debugging.
#gamedev #unity #indiedev #unitytips #gameprogramming #softwaredevelopment #unitydeveloper